A slickly produced video from leftist “racial justice” groups Applied Research Center and their publication Colorlines that was promoted by both Media Matters for America and Moveon as part of the Drop The I-Word campaign uses deceptive editing techniques in order to give viewers a false impression that hate crimes against Hispanics are on the rise.
By deliberately leaving out data that doesn’t help bolster their case, the video paints a factually incorrect picture in order to create a sense of danger. Both Drop The I-Word campaign coordinator Mónica Novoa and ARC Executive Director Rinku Sen need to explain why they allowed an intentionally deceptive video to go out on such an important national topic.
Here’s the video they released about a year ago, although the promotion by MoveOn took place recently and was featured on Fox News:
You’ll notice that towards the end of the video Colorlines and ARC are making a connection between violence and the use of the term “illegal alien” to describe illegal aliens. This charge of “violence” is even in the group’s graphic asking peopleto sign a pledge to oppose the term illegal to describe any human being, including illegal aliens.

At one point, the video quotes professor Robert Smith from Baruch College. He’s the fellow making the claim in the spot that
“Illegal” functions like a racial epithet. It’s a way of legitimizing violence against a particular group of people because of what they are. That’s the very definition of a hate crime.
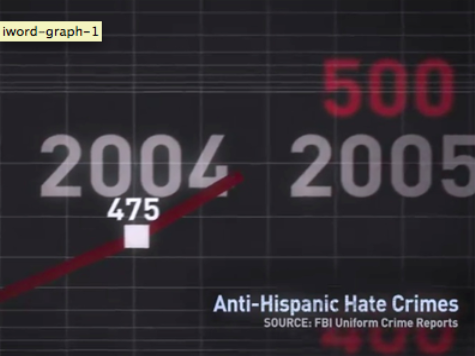
The graphics to go along with this show police cars and an arrested (white) suspect. Then the video shows an animated chart depicting how hate crimes against Hispanics are going up and up.
The graph starts at 2004:

And then animates higher and higher:

But something interesting happens, although most viewers are unlikely to notice. Even though the video was apparently produced in 2011, the data on the chart ends at 2007. I looked into the data using the FBI Uniform Crime Report source cited in the video and discovered why they stopped the animation at 2007; the number of Anti-Hispanic Hate Crimes went DOWN in 2008. And then DOWN again in 2009. Then they increased slightly, although not to previous levels.
Here’s a chart I made showing the actual date:

Here are the stats if you want to check yourself.
This is a serious breach of viewer trust; it is lying with statistics and editing, and it speaks to the level of desperation that these groups have to push their agenda onto the public.
COMMENTS
Please let us know if you're having issues with commenting.