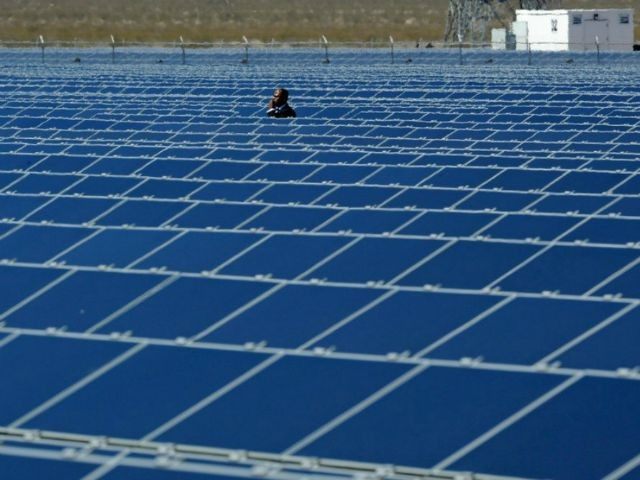
Despite the U.S. Congress passing the Consolidated Appropriations Act in December 2015 to slather another $9.3 billion of taxpayer credits on new solar power added to the electrical grid, California solar installments peaked in 2015 and are now headed south.
The extension of the federal Solar Investment Tax Credit (ITC) through 2021 was quietly tucked into 3 pages of the 887-page continuing resolution that allowed Congress to spend about $3.85 trillion this year. The nonpartisan Joint Committee on Taxation estimates that extending solar tax credits will cost taxpayers $9.3 billion.
As a result of massive taxpayer-funded subsidies, solar installations added 9.5 gigawatts of utility-scale power in 2016. That gave solar a nation-leading 40 percent share of all new electrical power capacity, dwarfing the 8.3 gigawatts of new fossil fuel capacity added in 2016, according to the Energy Information Agency.
California dominates solar power in the U.S., with 13,241 mega-watts of capacity, accounting for an overwhelming 44 percent national market share. Due to a marketing blitz by companies like SolarCity, about 71 percent of all solar capacity in the Golden State consists of residential installations.
California sought to continue its leadership in solar installations after Governor Jerry Brown passed SB 350, titled the “Clean Energy and Pollution Reduction Act of 2015.” The bill established 2030 targets to increase retail sales of renewable electricity to 50 percent and a requirement to double the energy efficiency savings in electricity and natural gas end uses by 2030.
With supposed experts claiming a huge amount of solar demand was being undermined due to the expiring of the federal investment tax credit, the renewal was expected to create another California boom. But the number of residential solar installations appears to have peaked in 2015 at 148,000 new installations, and the numbers fell for the first time in a decade, to 140,000 in 2016, according to the state.
A big selling point for renewing the solar investment tax credit was the promise that the cost of producing solar electric power would crash. But according to the California state website, the cost only fell by 2 percent from $.50 a kilowatt in 2015 to about $.49 a kilowatt in 2016.
Compared to natural gas on a national basis, solar costs 50 percent more to produce electricity than natural gas. That does not adjust for the fact that solar electric generation is availability for only an average of eight hours per day. During the other 16 hours a day, which includes peak the period of peak daily residential use during evening hours, the electrical grid must have 100 percent standby fossil fuel power generation capacity.
Another serious downside for solar power is that during sunny days in the spring and fall, when Californians are not using much air conditioning, the daily demand for electricity is low. As a result, the surge of midday solar power is more than the California electric grid can use.
Balancing solar power availability and consumer demand has become a major challenge for the Independent System Operator that manages California’s electric grid for about 30 million people. Nancy Traweek, who directs system operations, recently warned, “It’s constantly solving a constant problem, meaning you’re always trying to balance.”
Photo: file

COMMENTS
Please let us know if you're having issues with commenting.