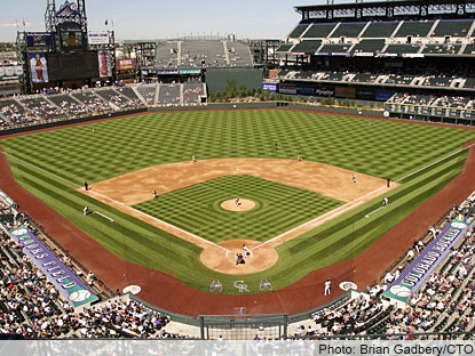

An evaluation of the impact all 30 ballparks have on pitchers winning games yielded the following table. A pitcher is 9 percent less likely to win a game in Coors Field as opposed to getting the same run support but pitching in another ballpark. San Francisco’s AT&T is the easiest park for pitchers based on the last four years of data prepared for the Value Add Baseball rankings:
| Team | Ballpark | Game Adjust |
|---|---|---|
| Colorado | Coors Field | 0.09 |
| Texas | Rangers Ballpark in Arlington | 0.04 |
| Boston | Fenway Park | 0.03 |
| Toronto | Rogers Centre | 0.03 |
| Chicago Cubs | Wrigley Field | 0.03 |
| Chicago Sox | U.S. Cellular Field | 0.02 |
| Arizona | Chase Field | 0.02 |
| NY Yankees | Yankee Stadium | 0.02 |
| Baltimore | Oriole Park at Camden Yards | 0.02 |
| Detroit | Comerica Park | 0.02 |
| Milwaukee | Miller Park | 0.02 |
| Cincinnati | Great American Ball Park | 0.02 |
| Miami | Marlins Park | 0.01 |
| Minnesota | Target Field | 0.00 |
| Philadelphia | Citizens Bank Park | 0.00 |
| Kansas City | Kauffman Stadium | 0.00 |
| Washington | Nationals Park | 0.00 |
| Houston | Minute Maid Park | 0.00 |
| Atlanta | Turner Field | -0.01 |
| Oakland | O.co Coliseum | -0.02 |
| St. Louis | Busch Stadium | -0.02 |
| Cleveland | Progressive Field | -0.02 |
| Pittsburgh | PNC Park | -0.02 |
| LA Dodgers | Dodger Stadium | -0.03 |
| NY Mets | Citi Field | -0.03 |
| LA Angels | Angel Stadium of Anaheim | -0.03 |
| Tampa Bay | Tropicana Field | -0.03 |
| San Diego | Petco Park | -0.04 |
| Seattle | Safeco Field | -0.04 |
| San Francisco | AT&T Park | -0.05 |
COMMENTS
Please let us know if you're having issues with commenting.