

Inflation Has Been Running Even Hotter Than Thought
The persistence of professional economists underestimating inflation in the Biden era will someday make a great topic for economic historians to study.
The Bureau of Economic Analysis on Friday released the March estimate for the personal consumption expenditure (PCE) price index. Both the headline and core indexes were up by 0.3 percent for the month, or an annualized rate of 3.9 percent. The twelve-month increase came in at 2.7 percent for headline inflation and 2.8 percent for core.
After yesterday’s gross domestic product report showed quarterly inflation rose by more than expected, a big question was whether this was due to a spike in March or upward revisions to prior months. Because a good deal of the monthly PCE inflation figure can be forecast based on equivalent measures in the consumer and producer price indexes released weeks earlier, the best interpretation was that the upside surprise was likely to be rooted in revisions.
That turned out to be right. January’s headline PCE estimate was revised up from 0.377 percent to 0.423 percent, a significant five basis point upward movement that is concealed by the fact that both round to four percent. Similarly, the core index was revised up five basis points from 0.452 to 0.502. February’s figures were revised up slightly.
Presenting the month-to-month figures in unrounded fractions of a percentage point can have the effect of downplaying the size of the difference. Does a few basis points really make a difference? To better appreciate the difference between the preliminary estimates and the revisions—and to see how hot inflation has been running—it helps to annualize the monthly numbers.
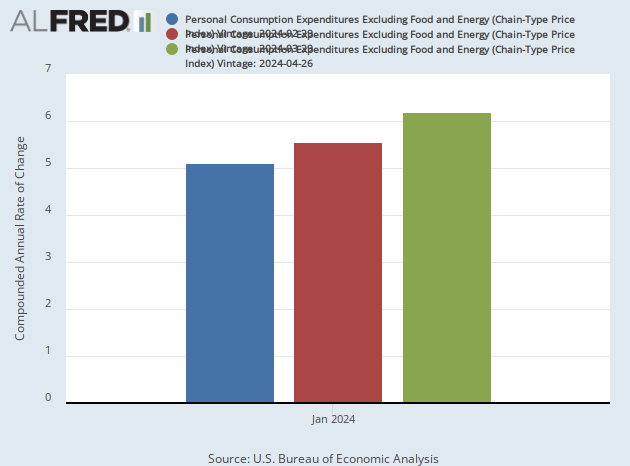
The one-month January headline PCE figure annualized to 4.6 percent inflation in last month’s estimate. After Friday’s revision, it is now 5.2 percent. The one-month annualized core figure was 5.6 percent for January and is now 6.2 percent. The story with core PCE inflation is basically the same: we’ve gone from the initial estimate of 5.1 percent annualized one-month inflation to 6.2 percent.
If we look back to the initial estimates for January’s PCE inflation, the impact of revisions is even starker. The one-month annualized number initially reported for January as 4.2 percent, a full percentage point before the current estimate for January.
The chart below shows the journey of January’s PCE inflation, with the blue bar representing the initial estimate released in late February, the red bar showing the first revision released in late March, and the latest revision in the green bar.
This is a discomfiting trend. It’s at least fair to wonder if the slight revisions seen in the February data will also be subject to further upward revisions and if the March data will follow the same pattern. The fact that the initial reports underestimated inflation and even the first revisions were inadequate raises the possibility that the more recent data is also running below the actual figures.
Since inflation can be volatile month-to-month, it’s worth paying attention to the three-month annualized figures and the trend those reveal about inflation. The initial report for January that was released in late February showed three-month annualized PCE headline inflation at 1.8 percent and core inflation at 1.6 percent. The February report showed this rising to 3.4 percent for headline and 3.5 percent for core. Now the three-month annualized figures are 4.4 percent for both core and headline.
Even Super Core Inflation Is Too Hot
Another way of seeing just how much hotter inflation is running than expected is to look at the projections from the Survey of Professional Forecasters for first quarter PCE inflation. Back in February of 2023, they were projecting 2.5 percent for core inflation. The number basically held steady in last year’s surveys, climbing to 2.6 percent in August and 2.7 percent in November. But the February survey saw the forecast fall all the way back down to 2.1 percent, not even in the ballpark of the reported 3.7 percent reported in Thursday’s first quarter GDP release.
One measure of inflation that has really gone the wrong way for those hoping for a rate cut has been what’s come to be known as “super core inflation.” This is the measure of services inflation that takes out energy and housing. This ran at a 4.8 percent one-month annualized rate in March, up from the 2.2 percent rate reported a month earlier. The three-month annualized rate was 5.5 percent, up from 4.5 percent.
This measure was originally conceived on the idea that the way shelter inflation was calculated was exaggerating current price increases because it did not reflect recent slowdowns in the pace of rent increases. In other words, it was invented to demonstrate that inflation really was lower than it looked in the usual indexes. Now it is showing that this isn’t the case. If you think super-core inflation should be the guide post, you should be even more worried than the headline and old-fashioned core suggest.
The View from the Fed
In what now seems like a different epoch, the Fed began warning in January that the market was getting ahead of itself by assuming the Fed was on the brink of cutting rates six or seven times this year. The Fed signaled at the January meeting that it was not going to cut in the first quarter of the year because it needed more confidence that inflation was sustainably returning to two percent.
So what did inflation look like back then? When the Fed met in January, it had in hand the December PCE price index that was released a few days earlier. Three month annualized PCE was up 0.5 percent. Core was up 1.5 percent. Several analysts and pundits were urging the Fed to declare victory over inflation.
Fortunately, the Fed took a cautious and prescient approach, looking for a sustained downturn in inflation to confirm the downward trend. As it turned out, inflation came roaring back.
So, what does this mean for interest rates? The Fed officials have seen an all-too-real example of the fact that inflation can accelerate suddenly and unexpectedly. If they were looking at 0.5 percent three-month annualized inflation in January and thinking it would take another four or five months before they could cut, the waiting period is probably even longer now. And that waiting period will likely not even start until the three-month average gets back down below the Fed’s target. So, we’re a long, long way off from any cuts.
The market still thinks the Fed may cut this year. On Friday, the futures market was implying a 58 percent chance of a September cut, a 68 percent chance of a November cut, and an 80 percent chance of a December cut. Those odds appear to still reflect an underestimation of the persistence of inflation and the Fed’s desire for evidence of a sustained movement toward two percent.
A better bet is that the Fed will not cut at all this year; and, if inflation stays hot, it may find that it will need to begin a new cycle of rate hikes sometime next year.
COMMENTS
Please let us know if you're having issues with commenting.