

Recently, after a four-year hiatus, the Institute of Education Sciences (IES) resumed its customary – since 2003 – comparison of the rigor state proficiency standards. The latest report deals with the rigor of state tests in 2013.
It is important to note at the outset that the comparison is not about how clear, demanding, or rigorous are the state academic content standards themselves – whether Texas TEKS or Common Core – but rather at what level is a “proficiency” declared on the state test, such as Texas STAAR, or the Common Core consortia tests – PARCC and Smarter Balanced. As every teacher knows, one can easily construct a difficult test on dumbed-down standards, or make an easy test on demanding ones.
Which brings us immediately to the first issue, that in 2013 there were no Common Core consortia tests around, and only a few states – Kentucky, New York, and North Carolina – had just the beginnings of their own versions of Common Core aligned test.
Yet this did not stop the promoters of Common Core – and the journalists that drink their kool aid – to use this report and praise the advantages of Common Core. Even the headline is wrong: “How Much Tougher is Common Core?” How would one know? The report is not about Common Core after all, but about the state tests cut-scores with at most three state tests aligned to Common Core. The headline already presumes – without much basis – that Common Core is “tougher” and the question is just “how much.”
The appropriate questions to ask about this report are:
How are state proficiency cut-scores comparing to NAEP “basic” and “proficient” levels?
How are state proficiency cut-scores changing over time?
Are state cut-scores correlated to state student achievement?
The IES report focuses mostly on answering the first question, and the short and simple answer is that state proficiency cut-scores vary quite widely but mostly lie between National Assessment of Educational Progress (NAEP) “basic” and “proficient,” with a handful of states below basic and a few above the proficient levels.
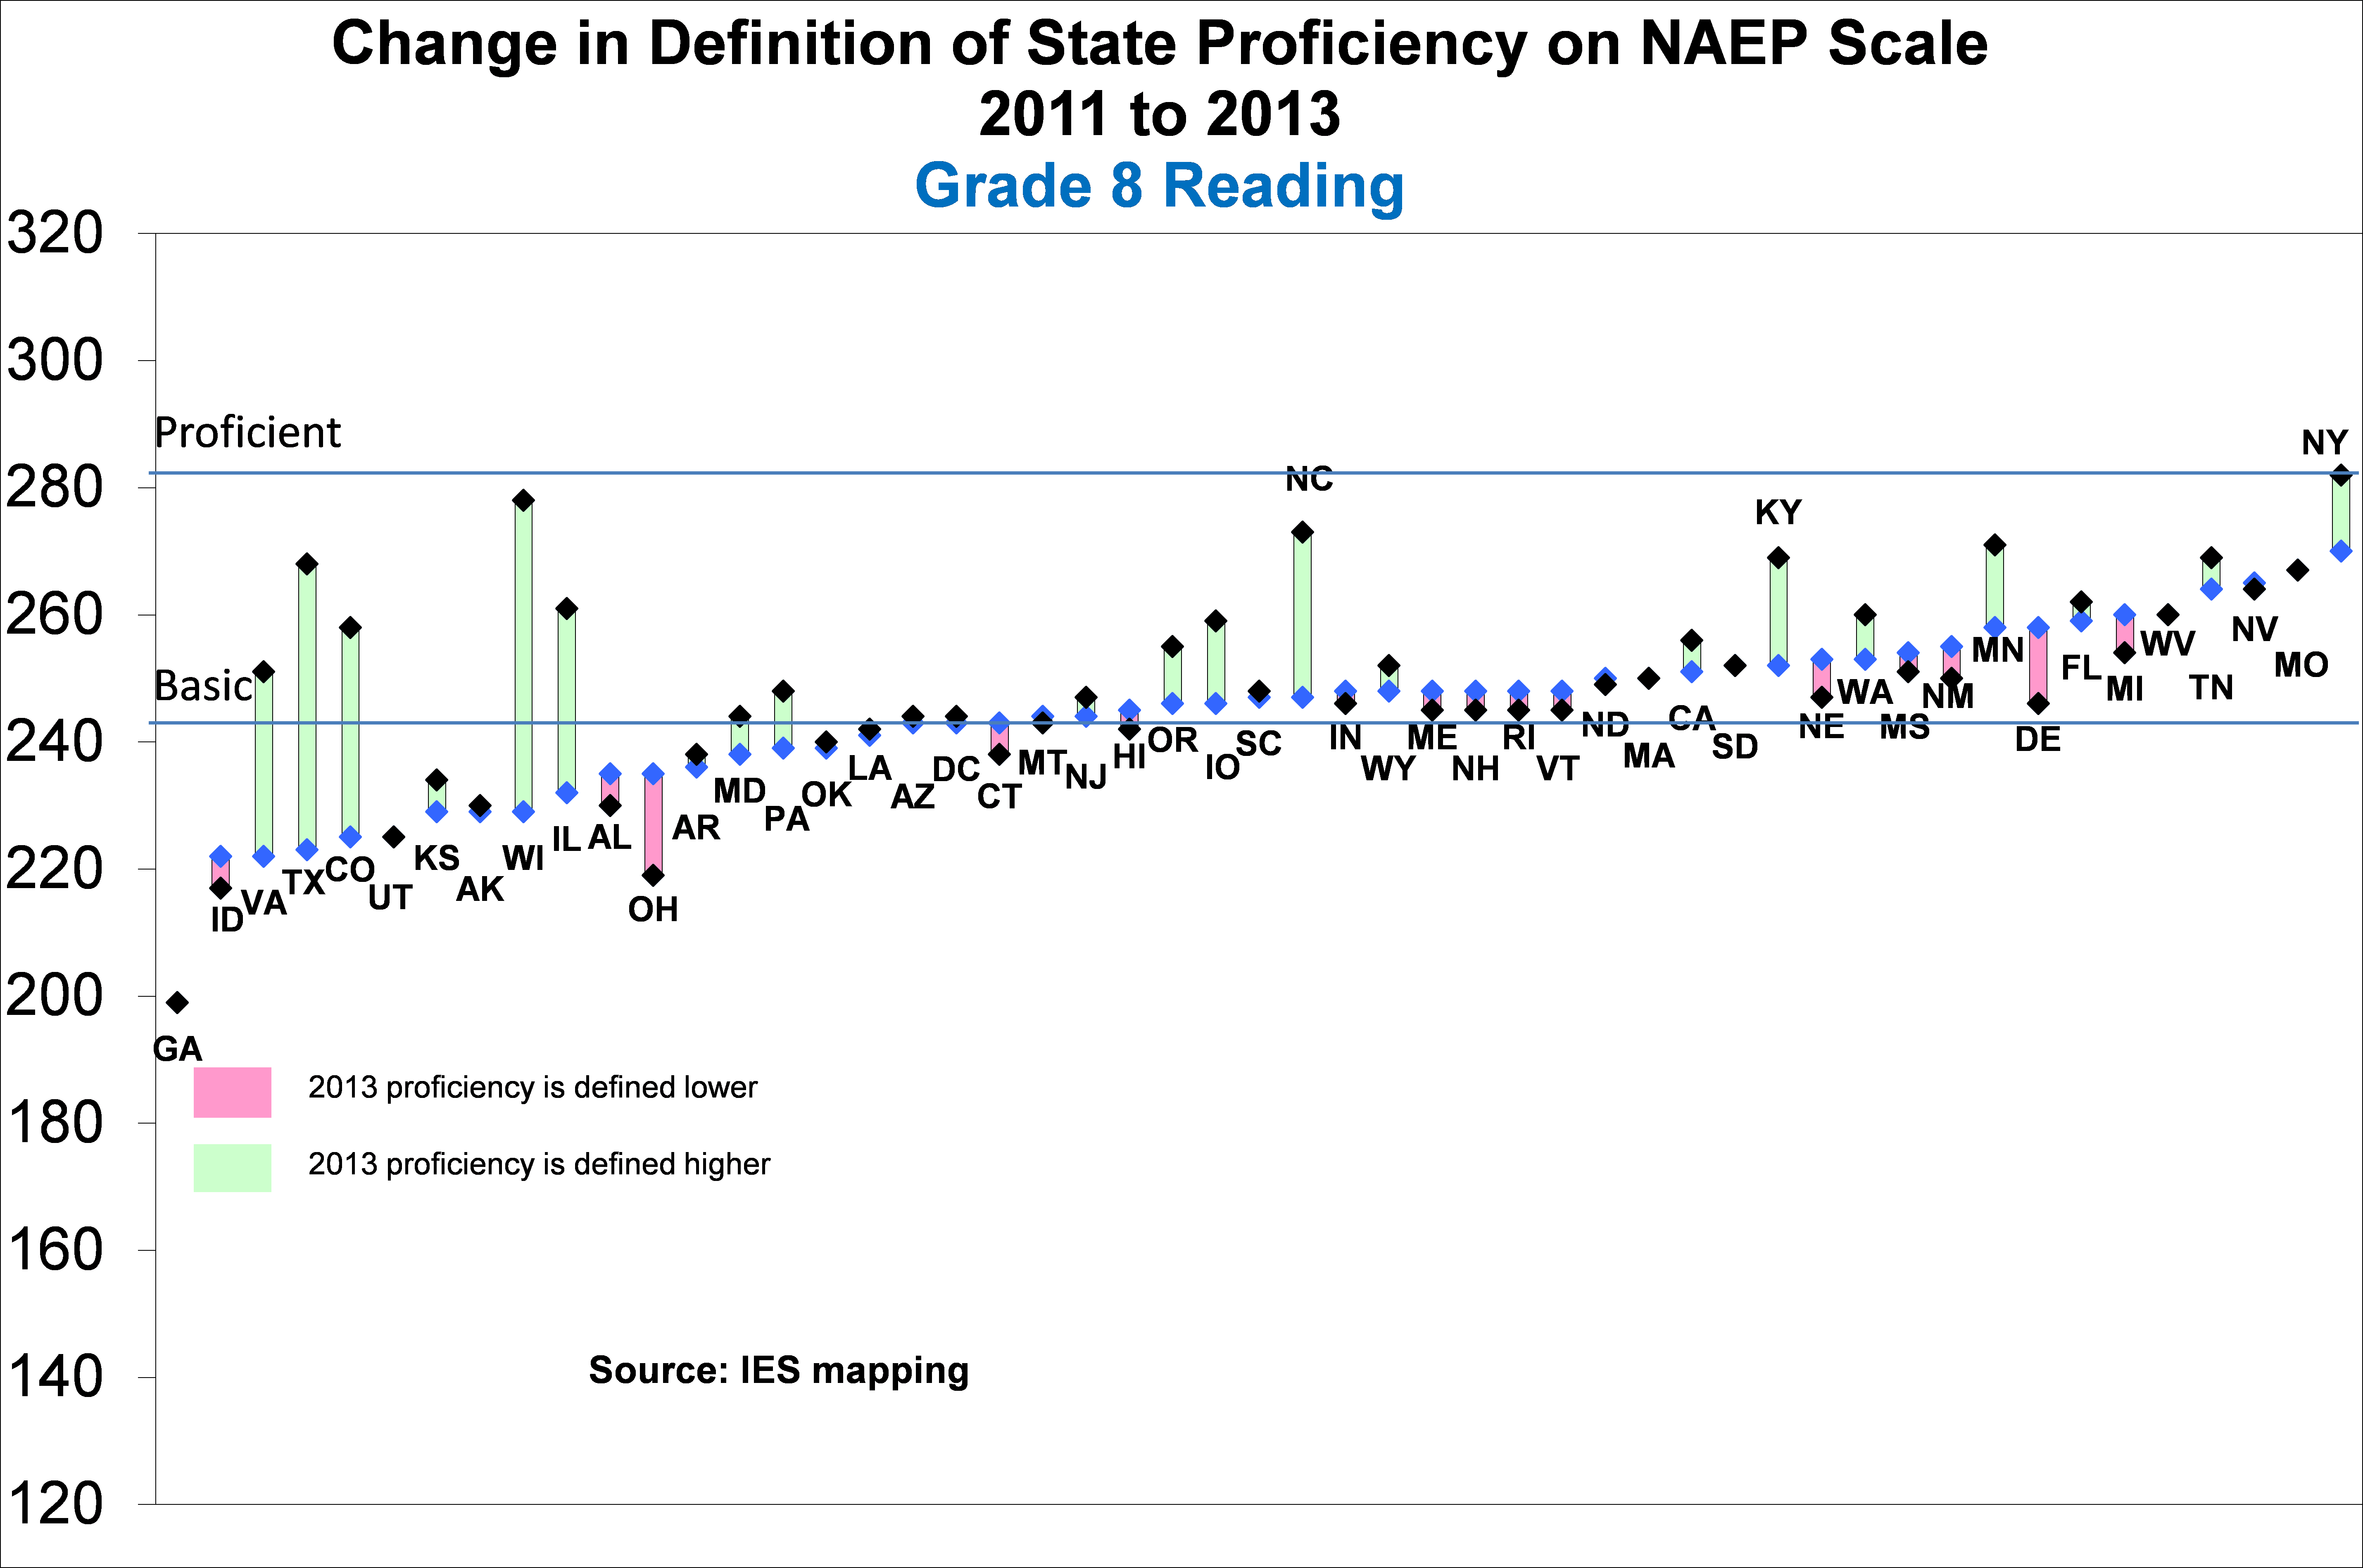
The answer to the second question is only touched on by the report, but is a bit more interesting. It turns out that many states have been raising their proficiency cut-scores over time. While it is true that Kentucky, New York, and North Carolina have significantly raised their cut-scores in 2013, so did many other states without Common Core tests like Texas, Virginia, Colorado, Illinois, Wisconsin, Florida and Minnesota most notable among them. The picture below shows the 2011à2013 changes in eighth grade reading, but eighth grade math and fourth grade changes in cut-scores look similar. Incidentally, this is not a new phenomenon – states have been modifying their cut-scores based on their experience since the beginning of No Child Left Behind (NCLB), but the general trend has been to raise them over time.
But the third question is the cardinal one: is there a causal relationship between cut-scores and student achievement? In other words, is much of the philosophy behind NCLB accountability regime actually working?
Checking on the correlation between NAEP scores and state effective cut-scores, I find the correlation being between low to non-existent, depending on the grade and subject. The best is grade 8 math where cut-scores explain less than 13 percent of achievement, and the worst is grade 8 reading where cut-scores explain less than 0.1 percent of achievement … essentially nothing.
Another way to look at the data is to look at the top and bottom states in terms of cut-scores. Typically one sees about half of the states above NAEP average and half below NAEP average in the eight lowest or the eight highest cut-scores states in the nation in both grades and both subjects. In other words, there seems to be little to no connection between cut-scores and achievement. Massachusetts is still number one in the nation both in subjects and grades even as its fourth grade math cut score is above NAEP proficient and its eighth grade reading cut-scores are barely above NAEP basic.
The final question we should ask ourselves regards the appropriate expectation for cut-scores. Is it true, as U.S. Department of Education officials claim, that NAEP “proficient” is the right level? They argue that it represents “college readiness.”
Perhaps it does, although we should also recall that the NAEP cut-scores have never been validated and are considered experimental by the Department of Education itself. Yet even if we accept that NAEP “proficient” cut-scores represent college-readiness, we also know that only about one-third of our high school graduates are truly college-ready – we have clear data from ACT and SAT indicating that. Should we really label two-thirds of our cohort as “failures” because they are not “college ready”?
National evaluation of NAEP “proficiency” level indicates that only in the top five highest achieving countries in the world would more than half of students successfully pass this “proficient” NAEP level (p. 3-14 here). Are we really interested in failing most of our children?
In 2010 Common Core pushed the country to declare that college-readiness is the goal of the high school. The current re-authorization of NCLB in the Senate pushes it even stronger … states must have standards that are “college ready.” This monumental change occurred without any serious public debate. About half of our college-entrants already fail to attain any degree. Do we really want to continue on this ill-considered path that unless one goes to college one is a failure? Why? High school was always about preparing young people for life, not to serve only as college prep.
Ze’ev Wurman is former senior policy adviser with the U.S. Department of Education under President George W. Bush.
COMMENTS
Please let us know if you're having issues with commenting.