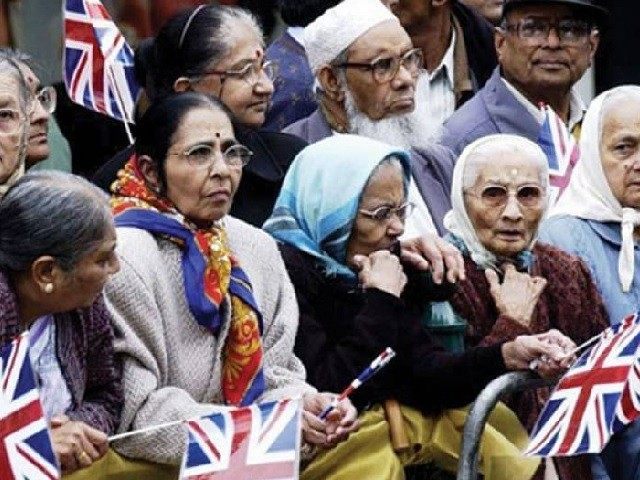
Two seats in this May’s General Election will be decided by a majority immigrant voting population, figures reveal.
East Ham and Brent North, both currently held by Labour, have more than 50 per cent of voters born overseas yet eligible to vote, the Daily Mail reports.
This figure, up 500,000 since the last election, represents one tenth of the electorate. A record four million people not born in the UK will be able to vote in may after a decade of mass immigration has seen population in Britain soar.
These voters will make up a third of the electorate in another 25 seats and at least a quarter in a further 50 seats, experts at Manchester University have found.
The majority of these seats are Labour held marginals with two currently in Tory control and two held by the Lib Dems.
Most of the foreign born voters are Indian, followed by Pakistan, the Republic of Ireland and Bangladesh. According to rules, 54 citizens of independent sovereign states can register to be on the electoral roll in this country so long as they have an address here. This is not an arrangement which is reciprocated: Britons cannot vote in Canada, Australia, India, Pakistan or Nigeria, the latter being the three most populous Commonwealth countries.
Former Prime Minister Gordon Brown commissioned a report which called for changes in these rules to prevent Commonwealth citizens without British citizenship from voting in General Elections. But the report was never acted on by Labour or by the Coalition.
The increasing number of foreign born voters was inevitable with Britain’s open door immigration policy and the astonishing figure of 200,000 citizenship applications which are now approved every year. This works out to be one every two and a half minutes.
The figures were compiled for the Migrants’ Rights Network and include up to two million immigrants granted British citizenship since 2000. In addition there are up to a million voters from the Commonwealth who can influence elections despite lacking British citizenship.
Labour have been accused of encouraging a large migrant population because they tend to vote for Labour, something backed up by Labour advisor Andrew Neather who said the party ran an ‘open door’ immigration policy when it was in power to ‘rub the Right’s nose in diversity and render their arguments out of date.’
And think tank MigrationWatch has said that ‘one possible reason’ why Labour ignored the report was that migrant voters tend to support Labour. In comparison, the Conservatives received just 16 per cent and Liberal Democrats just 14 per cent of votes cast by foreign born voters.
Co-author of the report Robert Ford said that “Migrant voters are almost as numerous as current Ukip supporters, but they are widely overlooked and risk being increasingly disaffected by mainstream politics and the fierce rhetoric around immigration caused partly by the rise of Ukip.”
He tried to blame the anti-EU party’s policy of openly discussing immigration of alienating the migrant vote, saying, “There is another side to this debate – millions of hardworking British citizens who came to this country from abroad who find this kind of rhetoric profoundly alienating.
“If the parties do not respond to that then they face lasting damage as this electorate is only going to become more significant.”
MigrationWatch chairman Lord Green of Deddington said the report “underlines the absurdity of giving the vote in Britain to foreign citizens from Commonwealth countries which do not give the vote to British residents in their own countries.”
“This is an issue which has been ducked for too long. It is not a question of hostility. It is a question of honesty and common sense.”
| Top 10 seats in London | Top 10 seats outside 10 London | ||
|---|---|---|---|
| East Ham | 51.0% | Leicester East | 39.3% |
| Brent North | 50.0% | Birmingham, Ladywood | 34.3% |
| West Ham | 47.1% | Slough | 33.2% |
| Brent Central | 44.6% | Leicester South | 29.7% |
| Ealing Southall | 43.4% | Luton South | 29.6% |
| Harrow East | 43.3% | Bradford West | 29.1% |
| Harrow West | 43.0% | Manchester, Gordon | 27.2% |
| Ilford South | 41.6% | Bimringham, Hall Green | 26.4% |
| Westminster North | 40.5% | Manchester Central | 25.0% |
| Cities of London and Westminster | 38.9% | Bimingham Perry Bar | 24.6% |

COMMENTS
Please let us know if you're having issues with commenting.