

Americans’ median pay packets have been flat since 1973, even though the vastly expanded federal government has justified its own salaries and its many massive spending and policy programs as a sure-fire way to boost education, productivity, and wages.
The colossal 44-year failure of the federal government to help grow American men’s wages — or even to reduce poverty rates — is laid bare in the latest report from the Census Bureau, “Income and Poverty in the United States: 2016.”
The dense report includes myriad detailed tables of data around one shocking chart, which reveals no growth in men’s wages for the past 44 years, or since President Richard Nixon was beginning his second term in office.
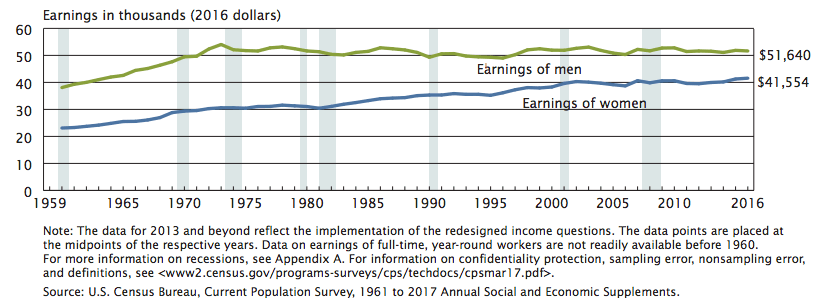
Median earning of full-time, year-round workers, 15 years and older, 1960 to 2016.
The sudden flatline followed a 31 percent rise in all men’s median wages from 1960 to 1972.

During the 44-year period since 1973, income among women grew by roughly 30 percent as more skilled and trained women entered the market, gained experience, and were promoted to better-paying jobs. Those opportunities and contributions are good news — but they do not change the reality that men’s income has been flat for 44 years.
In fact, the report notes that “the real median earnings of full-time, year-round working men were 1.1 percent lower in 2016 than in 2007.”
There are many explanations for the flat income, such as the massive growth in the labor supply when 30 million additional American women and roughly 30 million immigrants joined in the marketplace competition for good jobs. For example, a pro-immigration panel at the prestigious National Academies of Science estimated in 2016 that the huge government-imposed inflow of immigrants since 1965 has imposed a hidden 5 percent “immigration tax” on Americans’ pay packets.
Technology has made many individuals workers more productive but also sidelined many others, such as newspaper printers and steelworkers. Peaceful international trade has allowed men to sell more products overseas but also allowed employers to hire foreign workers instead of Americans. Whatever the combinations of reasons, the mid-point for men’s income has been flat for 44 years, according to the Census Bureau.
The flat-earnings chart needs some explanation:
It shows only inflation-adjusted, pre-tax pay packets, so it excludes the impact of inflation, company benefits, or taxes and government benefits, such as food-stamps and tax-breaks for children, or of Obamacare’s subsidies and spending obligations.
It shows median income, which is the midpoint of the income scale. Half the people earn above the line, half the people earn below the line. Average income would be higher, but less revealing, because a higher share of income is going to the highest earners, compared to back in the 1970s.
The chart shows the income of year-round, full-time workers, excluding part-workers or seasonal workers, or those who work on-and-off under contracts. The chart does not make distinctions by race.
The chart shows individuals’ income, not the income of households, which has fluctuated as the average number of children or adults has declined.
The chart only shows income, but not the quality of goods in the stores, such as Starbucks coffee, cheap products imported from China, high-tech music players, improved autos or better health-care. That rise in product quality from competing companies — not claimed policy improvements from federal agencies — has provided the vast majority of material gains for Americans amid flat incomes.
The details are provided on Table A-4, on page 49 of this PDF.
The median earnings for all men employed year-round was $51,640 in 2016, which is still far below the $54,030 earned by full-time men in 1973. It is also below the $51,938 earned in the 2000 Internet boom, or the $52,222 earned in the 2007 property bubble when large-scale legal and illegal immigration provided employers with millions of alternative imported workers.
The post-1973 reality of flat income is a huge contrast to the rapid growth from 1960 up to the 1973 oil shock and the reopened inflow of immigrant labor after 1965. During the twelves years 1960 to 1972, the median average wages for all males — including minorities, seasonal workers, and contract workers — rose from by 31 percent, from $31,926 to $41,013.
When the income of all men is gauged, the Bureau concluded that all men’s median income in 1973 was $41,935. It dropped after 1973 and rose back up to $43,360 in 1999 as companies competed for the few unemployed workers during the first Internet boom. Income crashed in 2008 to a depression-low of $39,636 in 2012 once the federal government’s real-estate bubble burst. Since then, income has slowly climbed back to $42,220 in 2016 amid the continuous public protest against the federal government’s cheap-labor economic strategy, which is exemplified by the bipartisan 2013 “Gang of Eight” amnesty legislation.
Other data in the report shows that the nation’s poverty rates have barely budged since the 1960s, although many people in the United States are wealthier than many people n Europe. For example, the percentage of American said to be in poverty was 11.1 percent in 1973 and 12.7 percent in 2016.
That national poverty rate climbed, in part, because of the population of Latinos spiked from 10.8 million in 1973 to 57.6 million in 2016. Poverty among Latinos was 19 percent in 2016, little changed from 1973.
The report also noted that:
The official poverty rate decreased by 0.8 percentage points between 2015 and 2016. At 12.7 percent, the 2016 poverty rate is not statistically different from 2007 (12.5 percent), the year before the most recent recession.
In real terms, median earnings of full-time, year-round working women in 2016 were 2.3 percent higher than their 2007 median, the year before the most recent recession. The real median earnings of full-time, year-round working men were 1.1 percent lower in 2016 than in 2007.
In 2017, the number and percentage of shared households remained higher than in 2007, the year before the most recent recession. In 2007, 17.0 percent of all households were shared households, totaling 19.7 million households. In 2017, 19.4 percent of all households were shared households, totaling 24.6 million households.
Read it all here.
COMMENTS
Please let us know if you're having issues with commenting.