

Those Halloween Market Jitters
Superstitious investors can breathe a sigh of relief. We passed another anniversary of Black Monday without a stock market crash.
Every year around this time, as the cool winds begin to blow the red and yellow leaves from their lofty perches, nervous investors worry whether we will see a repeat of the stunning 20 percent stock market crash that the world witnessed on October 19, 1987. The Stock Trader’s Almanac captures the perennial fear by describing October as the Jinx Month.
Historically, October is actually not all that bad as its reputation would lead you to think. It’s true that 1929’s Black Thursday took place on October 24 and the Panic of 1907 began with the October run on the Knickerbocker Trust. And there were lesser October market crashes in 1978, 1979, 1989, and 1997.
But the Dow Jones Industrial Average has increased an average of 0.5 percent in October since the index’s inception, according to Barron’s. The S&P 500 has seen average gains of 0.6 percent and the Nasdaq Composite 0.8 percent. By most measures, October is only the fifth worst for stocks, which puts it in the middle of the pack.
On a more recent time scale, October looks even better. According to Terry Sandven, chief equity strategist at U.S. Bank Wealth Management, over the past 20 years, October sees an average S&P 500 return of 1.4 percent, giving it a better batting average than all but three other months.
This Time It’s Different (No, Really, It Is)
This year’s anxiety over a 1987 repeat has centered around six similarities: a strong start to the year that was concentrated in just a few stocks, a third-quarter sell-off, more economic growth than expected, a strong dollar, rising interest rates, and a falling money supply.
There definitely was a family resemblance to this year’s first-half run-up in the major stock indexes with 1987’s. Both were highly concentrated among just a handful of stocks, creating worries about market breadth. But the 1987 gain of around 39 percent in the S&P 500 through August dwarfs this year’s bull run of 20.5 percent through the July peak.
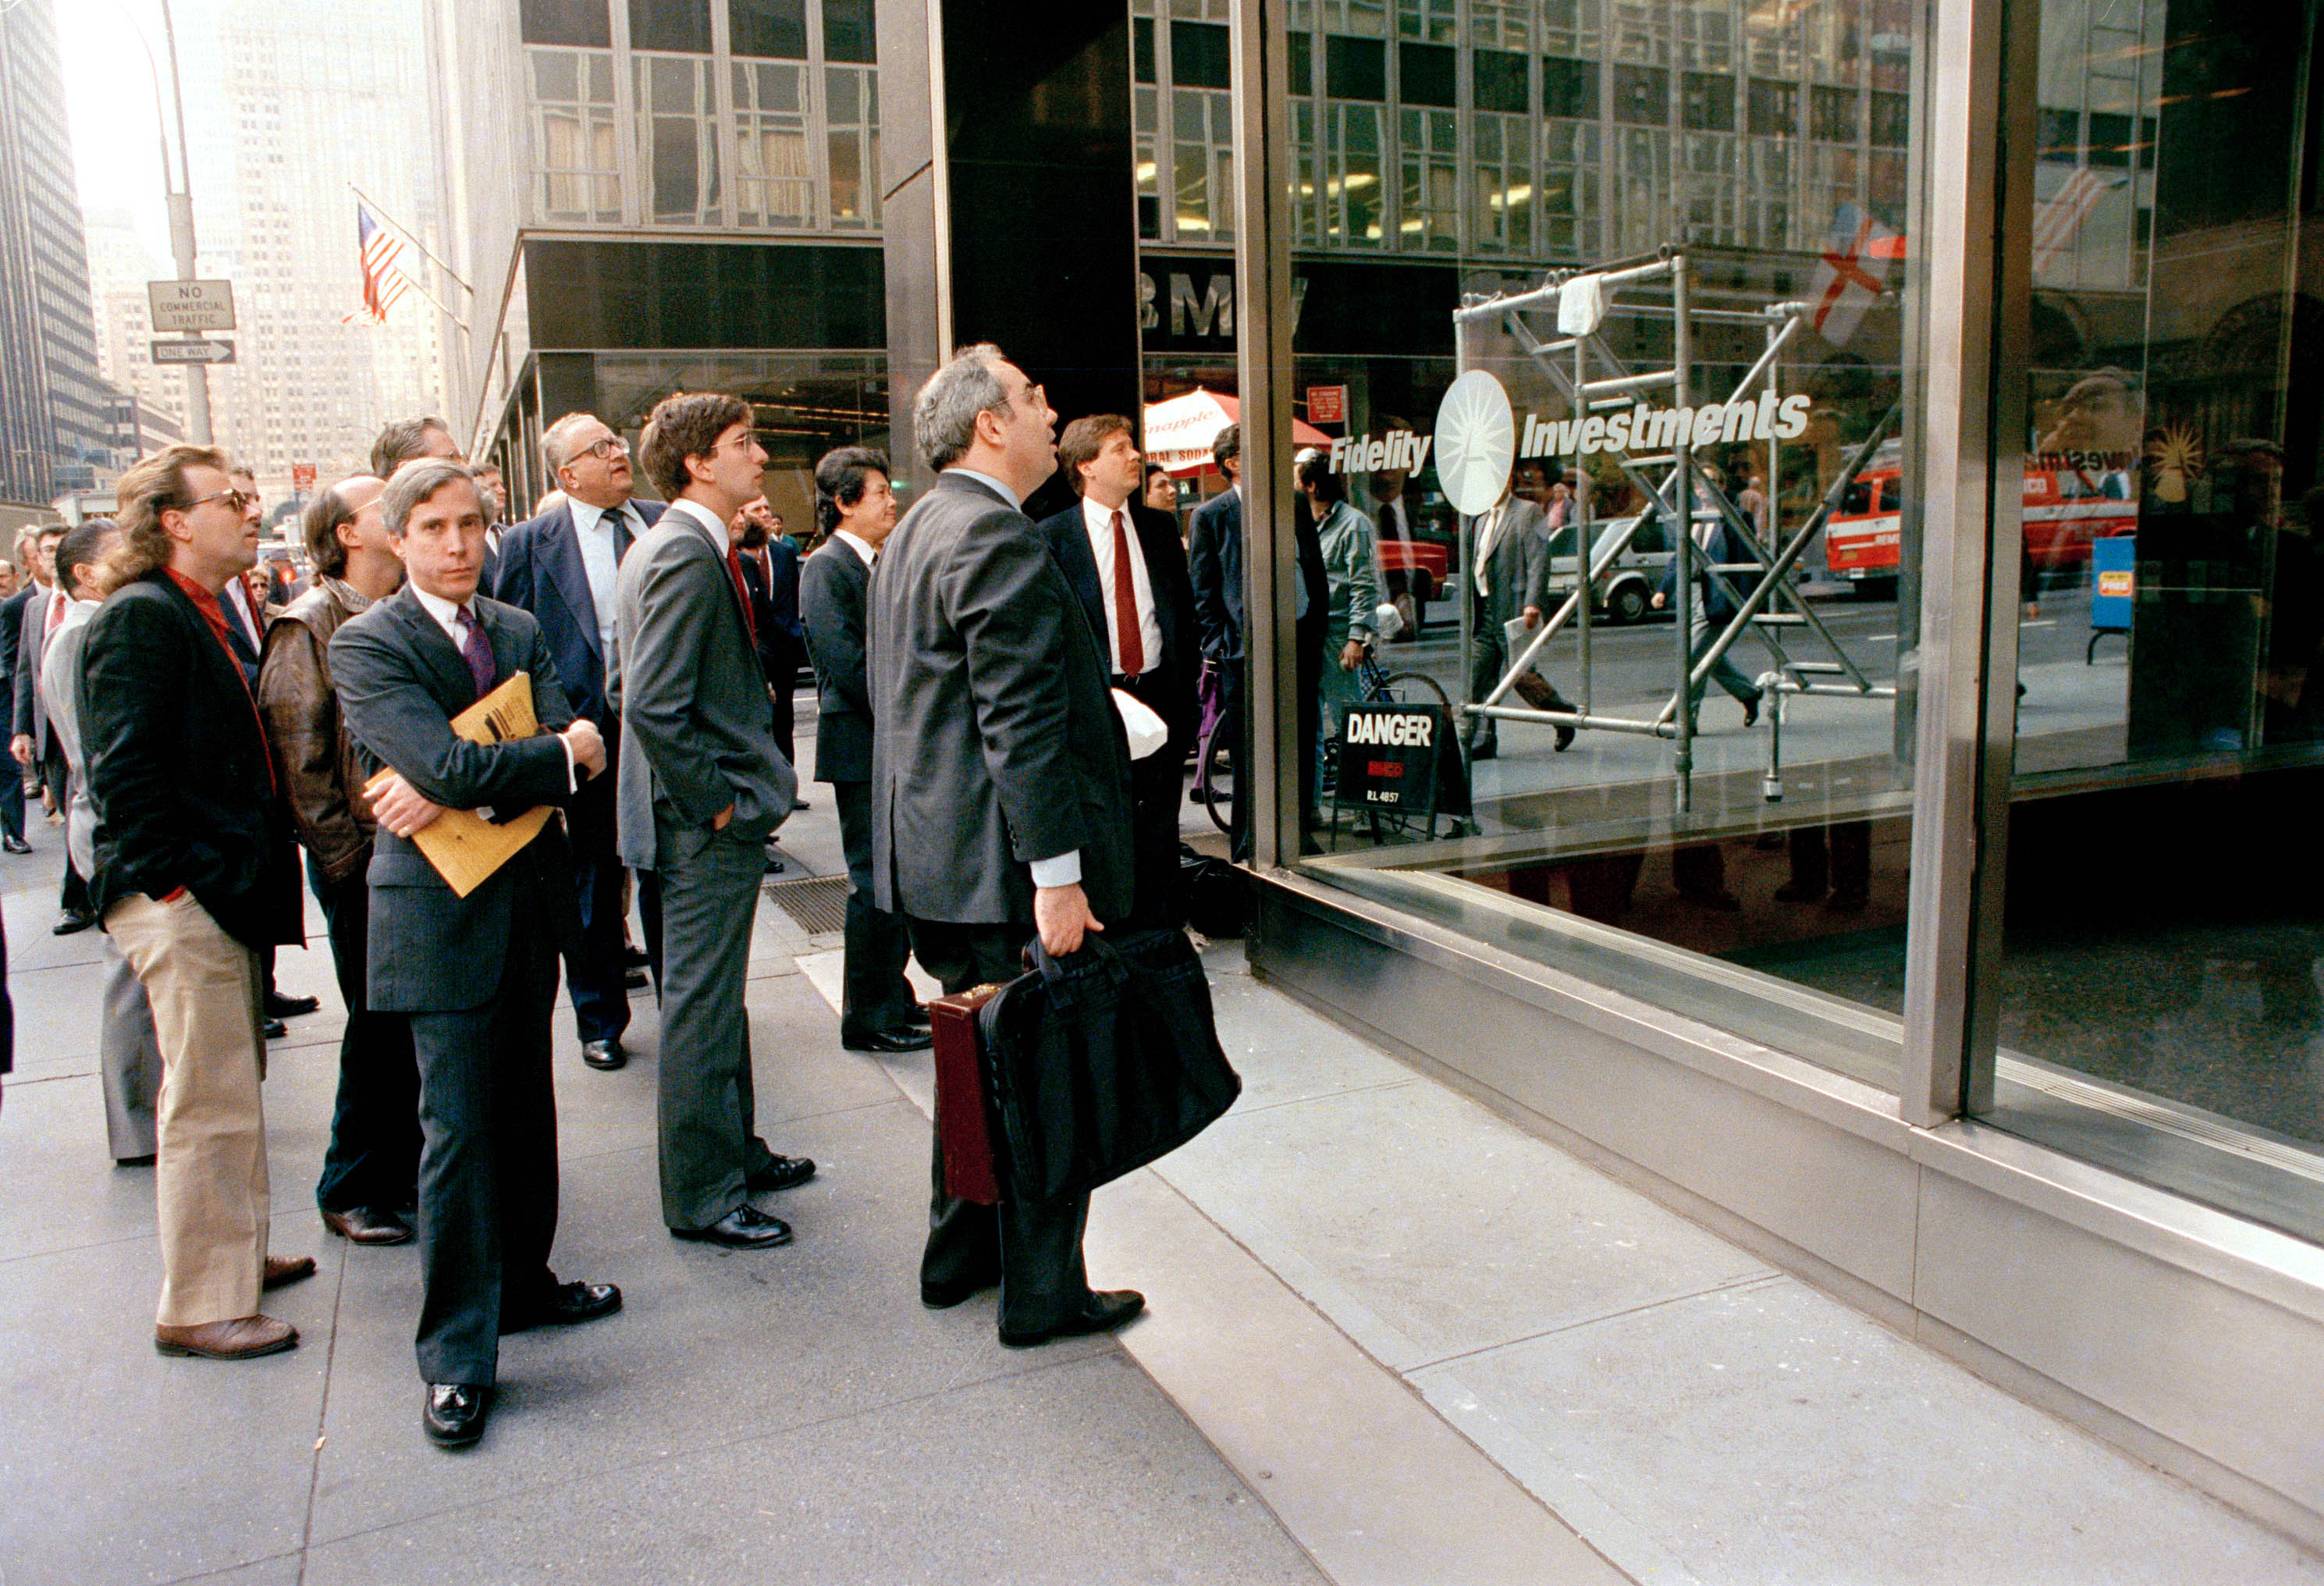
Somber-faced men stand outside the New York offices of a major mutual fund group watching an electronic display inside report the precipitous fall in the stock market on “Black Monday,” October 19, 1987, in New York. (AP Photo/G. Paul Burnett)
The Blue Chip consensus was for 2.5 percent growth in real gross domestic product in 1987, around the same growth as the prior two years. The economy unexpectedly accelerated through the year, however, and ended the year with nearly 3.5 percent growth. The Consumer Price Index rose 3.6 percent in 1987, very close to the level of inflation the country is seeing right now.
Perhaps the most concerning resemblance between 2023 and 1987 is what happened to the money supply.
Here’s how two economists explain the situation on the editorial pages of the Wall Street Journal:
The Federal Reserve’s policies are threatening U.S. financial markets and the economy. They are in danger of a steep recession and the risk of a repeat of 1987’s Black Monday.
Early in the pandemic, the volume of U.S. dollars in circulation soared. For two years starting in March 2020, the M2 money supply—a measure of the cash and checkable deposits in circulation plus savings deposits and other easily convertible assets—grew at an unprecedented annualized rate of 16.5%. That is more than three times the appropriate rate for hitting the Fed’s 2% inflation target.
Then, in March 2022, the Fed changed course, first tightening the money supply by increasing the federal-funds rate and then introducing quantitative tightening. Between July 2022 and August 2023, the M2 supply contracted by 3.9%, the most extreme contraction since 1933…
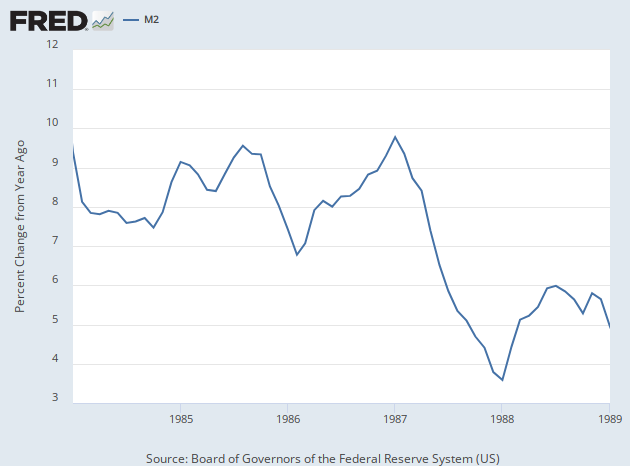
This brings us to the stock-market crash of 1987. In that year the key 10-year bond yield rose steeply from January onward (from 7% in January to 10% by Black Monday in October) and the money supply slowed sharply.
In 1987 growth of M2 declined by almost half, from 9.7% year-on-year in January to 4.9% in September, while M3—no longer published by the Fed—slowed from 8.7% to 3.6% over the same period. A bond-market crunch and monetary squeeze together led to a sudden, drastic reassessment of equity-market valuations. The same could happen today, particularly since the current jump in bond yields and monetary squeeze are much more pronounced than in 1987.
With all due respect, we will note that the money supply is no longer contracting. After falling for the first half of this year, it has since stabilized. The tightening that has some monetarists so concerned seems to be a thing of the past. And with the Fed signaling that the last rate hike was very likely in July, there’s little reason to expect a sudden return to a falling M2.
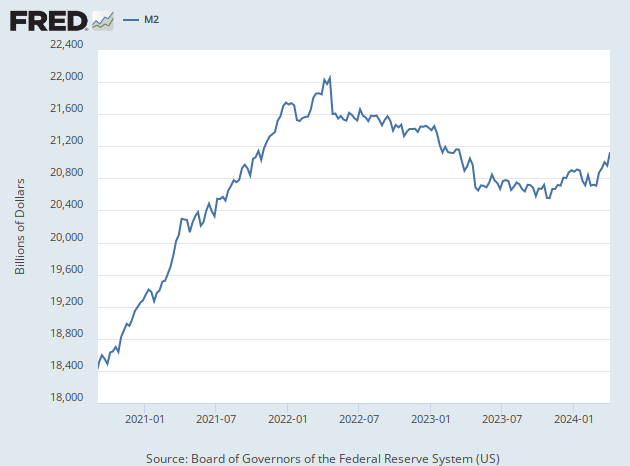
Let’s look at the second derivative—the growth of the money supply—that the Wall Street Journal essay emphasizes. As the chart below shows, the growth of M2 fell sharply in 1987—for the entire year. The crash came after eight months of sustained decline.
Here’s the chart for the last few years. It shows that there was a prolonged and sustained decline in the rate of growth of M2. But that ended midway through this year. M2 is still in year-over-year contraction territory, but it is has stabilized.

In other words, this does not look to us like 1987 all over again.
COMMENTS
Please let us know if you're having issues with commenting.