
Minnesota has the highest rate of refugee tuberculosis (TB) per capita of any state in the country by a wide margin, with 4.08 cases of active TB diagnosed among refugees for every 100,000 residents in the general population between 2012 and 2015.
Minnesota is followed by Nebraska in the refugee TB per capita rate, where it is 1.26 per 100,000 residents; and North Dakota, where the rate is 1.19 per 100,000 residents.
This data comes from the same four Centers for Disease Control (CDC) annual publications titled Reported Tuberculosis in the United States which Breitbart News reported earlier this month, confirming that 1,565 refugees were diagnosed with TB between 2012 and 2015, more than three times what had been previously reported.
In many states, including Minnesota, the high refugee TB per capita rate explains why refugees who constitute less than one percent of the population accounted for significantly more than 20 times that percentage of all cases of TB diagnosed during the 2012 to 2015 period.
In Minnesota, 36 percent, or 225 out of 610 total cases of TB, were diagnosed in refugees, 55 times greater than the 0.7 percent of the state’s estimated population of refugees, by one measure.
In Kansas, 16 percent, or 25 out of 154 total cases of TB, were diagnosed in refugees, 112 times greater than the 0.14 percent of the state’s estimated population of refugees.
States with high refugee TB per capita rates and high percentages of total TB attributable to refugees also accept a significant number of refugees from high TB burden countries.
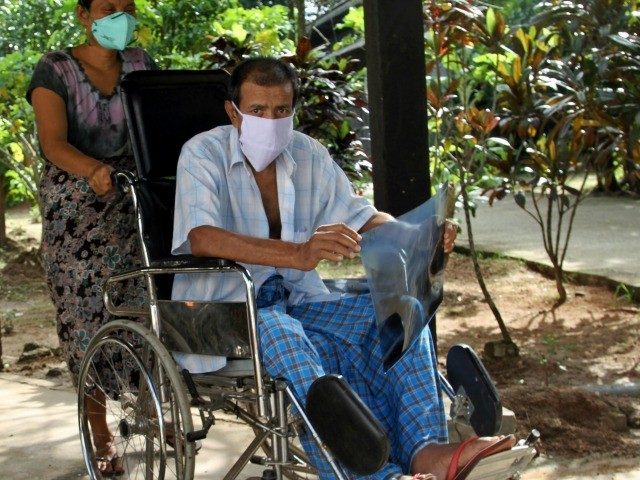
Minnesota, for instance, resettles a significant number of Somalis. Indiana resettles many Burmese. More than half of the 4,368 refugees resettled in New Hampshire since FY 2008 are from Bhutan, according to the State Department. Somalia, Burma, and Bhutan are all high TB burden countries.
Nationally, 4.5 percent of all TB cases diagnosed in the 46 states that reported this data were diagnosed in refugees. This percentage is 19 times greater than the percentage of the population that arrived as refugees between 2003 and 2015 (0.235 percent).
The 36,862 refugees that arrived in Minnesota during the 13 years between 2003 and 2015 accounted for less than one percent (0.7 percent) of the state’s population of the state’s 5.5 million population. The total refugee population in Minnesota, or any state, is probably greater than this 13 year refugee arrival number, due to refugees who arrived prior to 2003, as well as secondary migration from one state to another.
Rounding out the top ten states for active TB-diagnosed refugees per 100,000 residents are Iowa (1.02), Idaho (0.95), Georgia (0.94), New Hampshire (0.9), Indiana (0.87), Utah (0.87), and tied for tenth are Kansas (0.86), and Kentucky (0.86). Indiana, Wisconsin, Colorado, Ohio, and Maryland filled out the 11th to 15 positions, as shown in the table below, Refugee TB Per Capita, Top 15 States, 2012 to 2015.
| Refugee TB Per Capita, Top 15 States, 2012 to 2015 | |||||||||||||||||||||||
| State | RTB per capita* | % TB Refugees | % Pop. Refugees** | ||||||||||||||||||||
| 1 | Minnesota | 4.08 | 36.9% | 0.7% | |||||||||||||||||||
| 2 | Nebraska | 1.26 | 21.4% | 0.5% | |||||||||||||||||||
| 3 | North Dakota | 1.19 | 14.5% | 0.6% | |||||||||||||||||||
| 4 | Iowa | 1.02 | 17.4% | 0.2% | |||||||||||||||||||
| 5 | Idaho | 0.95 | 34.0% | 0.6% | |||||||||||||||||||
| 6 | Georgia | 0.94 | 7.1% | 0.3% | |||||||||||||||||||
| 7 | New Hampshire | 0.90 | 25.0% | 0.4% | |||||||||||||||||||
| 8 | Utah | 0.87 | 19.6% | 0.4% | |||||||||||||||||||
| 9 | Kansas | 0.86 | 16.2% | 0.1% | |||||||||||||||||||
| 10 | Kentucky | 0.86 | 13.3% | 0.4% | |||||||||||||||||||
| 11 | Indiana | 0.80 | 13.8% | 0.2% | |||||||||||||||||||
| 12 | Wisconsin | 0.74 | 19.1% | 0.2% | |||||||||||||||||||
| 13 | Colorado | 0.70 | 14.2% | 0.3% | |||||||||||||||||||
| 14 | Ohio | 0.70 | 5.9% | 0.2% | |||||||||||||||||||
| 15 | Maryland | 0.70 | 5.4% | 0.2% | |||||||||||||||||||
| Total US | 0.49 | 4.1% | 0.2% | ||||||||||||||||||||
| Less NR*** | 0.57 | 4.5% | 0.2% | ||||||||||||||||||||
| Sources: | |||||||||||||||||||||||
| Reported Tuberculosis in the United States, 2012, 2013, 2014, 2015 | |||||||||||||||||||||||
| Department of State interactive website at www.wrapsnet.org | |||||||||||||||||||||||
2016 population estimates from the US Census Bureau
|
|||||||||||||||||||||||
Four states and two cities did not provide the CDC with category breakdown for foreign-born residents who were diagnosed with TB by immigration status at arrival: Virginia, Washington, Illinois, Arizona, Washington, D.C., and New York City.
“State, county, and local public health agencies have the primary responsibility for preventing and controlling tuberculosis (TB) in their jurisdiction, and serve as the public health authority for TB, including the responsibility and authority for conducting TB surveillance,” a spokesperson for the CDC told Breitbart News.
“These TB control programs voluntarily share TB surveillance data with CDC through the National TB Surveillance System. Because state and local reporting capacity and privacy laws vary, the depth of data reported in CDC’s national report also varies,” the spokesperson added.
“CDC encourages states/jurisdictions to provide as complete information as possible, but there is no requirement that they provide immigration status as part of routine surveillance,” the spokesperson concluded.
The Virginia Department of Health and the Arizona Department of Health Services told Breitbart News they do not track immigration status upon first arrival of foreign-born residents who contract TB. As Breitbart News reported previously, slightly more than six percent of the foreign-born cases of TB diagnosed were categorized with refugee immigration status upon first arrival.
The Illinois Department of Public Health (IDPH) told Breitbart News that it does track refugees with TB, but did not report that information to the Centers for Disease Control.
IDPH told Breitbart News that four cases of TB have been diagnosed in refugees resettled in the state of Illinois, but did not specify in which year or years those diagnoses occurred.
The Washington State Department of Health told Breitbart News that 11 cases of TB were diagnosed in refugees in 2015, but has not yet provided that data for 2012, 2013, or 2014.
Breitbart News contacted public health authorities in New York City and Washington, D.C. to learn if they track refugee TB data and does not provide that information to the CDC, but has not yet received a response from either city.
One state, Tennessee, did not provide foreign-born TB data by immigration status upon first arrival in 2012 and 2013, but has subsequently provided that data in 2014 and 2015.
Supporting tables are included below.
| Refugees as Percentage of Population | |||
| Top 15 Refugee TB Per Capita States, 2012 to 2015 | |||
| Refugee Arrrivals | |||
| State | % Pop. Refugees | 2003 to 2015* | Population |
| Minnesota | 0.7% | 36,862 | 5,519,952 |
| Nebraska | 0.5% | 8,913 | 1,907,116 |
| North Dakota | 0.6% | 4,852 | 757,952 |
| Iowa | 0.2% | 6,689 | 3,134,693 |
| Idaho | 0.6% | 10,339 | 1,683,140 |
| Georgia | 0.3% | 30,797 | 10,310,371 |
| New Hampshire | 0.4% | 5,347 | 1,334,795 |
| Utah | 0.4% | 12,103 | 3,051,217 |
| Kansas | 0.1% | 4,183 | 2,907,289 |
| Kentucky | 0.4% | 16,895 | 4,436,974 |
| Indiana | 0.2% | 14,658 | 6,633,053 |
| Wisconsin | 0.2% | 11,542 | 5,778,708 |
| Colorado | 0.3% | 17,523 | 5,540,545 |
| Ohio | 0.2% | 25,203 | 11,614,373 |
| Maryland | 0.2% | 13,372 | 6,016,447 |
| Total US | 0.2% | 766,625 | 321,418,820 |
| Less NR** | 0.2% | 656,005 | 276,763,769 |
| Sources: | |||
| Reported Tuberculosis in the United States, 2012, 2013, 2014, 2015 | |||
| Department of State interactive website at www.wrapsnet.org | |||
| 2016 population estimates from the US Census Bureau | |||
| *January 21, 2003 to December 31, 2015
** Non reporting states Arizona, Illinois, Virginia, Washington, not included |
|||
| Total TB Cases and Refuge TB Cases | |||
| Top 15 Refugee TB Per Capita States, 2012 to 2015 | |||
| State | Total | Refugees | Refugee % |
| Minnesota | 610 | 225 | 36.9% |
| Nebraska | 112 | 24 | 21.4% |
| North Dakota | 62 | 9 | 14.5% |
| Iowa | 184 | 32 | 17.4% |
| Idaho | 47 | 16 | 34.0% |
| Georgia | 1,355 | 96 | 7.1% |
| New Hampshire | 48 | 12 | 25.0% |
| Utah | 138 | 27 | 19.6% |
| Kansas | 154 | 25 | 16.2% |
| Kentucky | 286 | 38 | 13.3% |
| Indiana | 420 | 58 | 13.8% |
| Wisconsin | 225 | 43 | 19.1% |
| Colorado | 275 | 39 | 14.2% |
| Ohio | 596 | 35 | 5.9% |
| Maryland | 773 | 42 | 5.4% |
| Total US | 38,429 | 1,565 | 4.1% |
| Less NR* | 34,545 | 1,565 | 4.5% |
| Sources: | |||
| Reported Tuberculosis in the United States, 2012, 2013, 2014, 2015 | |||
| Department of State interactive website at www.wrapsnet.org | |||
| 2016 population estimates from the US Census Bureau | |||
| * Non reporting states Arizona, Illinois, Virginia, Washington, not included | |||
| Total TB and Refugee TB per 100,000 general population | |||
| Refugee TB Per Capita, Top 15 States, 2012 to 2015 | |||
| RTB per capita | RTB per capita | Total TB per capita | |
| State | 4 year total | Annualized ave. | 4 year ave. |
| Minnesota | 4.08 | 1.02 | 2.80 |
| Nebraska | 1.26 | 0.32 | 1.50 |
| North Dakota | 1.19 | 0.30 | 2.15 |
| Iowa | 1.02 | 0.26 | 1.48 |
| Idaho | 0.95 | 0.24 | 0.75 |
| Georgia | 0.94 | 0.24 | 3.38 |
| New Hampshire | 0.90 | 0.23 | 0.90 |
| Utah | 0.87 | 0.22 | 1.18 |
| Kansas | 0.86 | 0.22 | 1.33 |
| Kentucky | 0.86 | 0.22 | 1.60 |
| Indiana | 0.80 | 0.20 | 1.60 |
| Wisconsin | 0.74 | 0.19 | 1.03 |
| Colorado | 0.70 | 0.18 | 1.28 |
| Ohio | 0.70 | 0.18 | 1.28 |
| Maryland | 0.70 | 0.18 | 3.25 |
| Total US | 0.49 | 0.12 | 3.03 |
| Sources: | |||
| Reported Tuberculosis in the United States, 2012, 2013, 2014, 2015 | |||
| Department of State interactive website at www.wrapsnet.org | |||
| 2016 population estimates from the US Census Bureau | |||
COMMENTS
Please let us know if you're having issues with commenting.